The 5 HubSpot Reports Every Sales Leader Should Check Every Monday
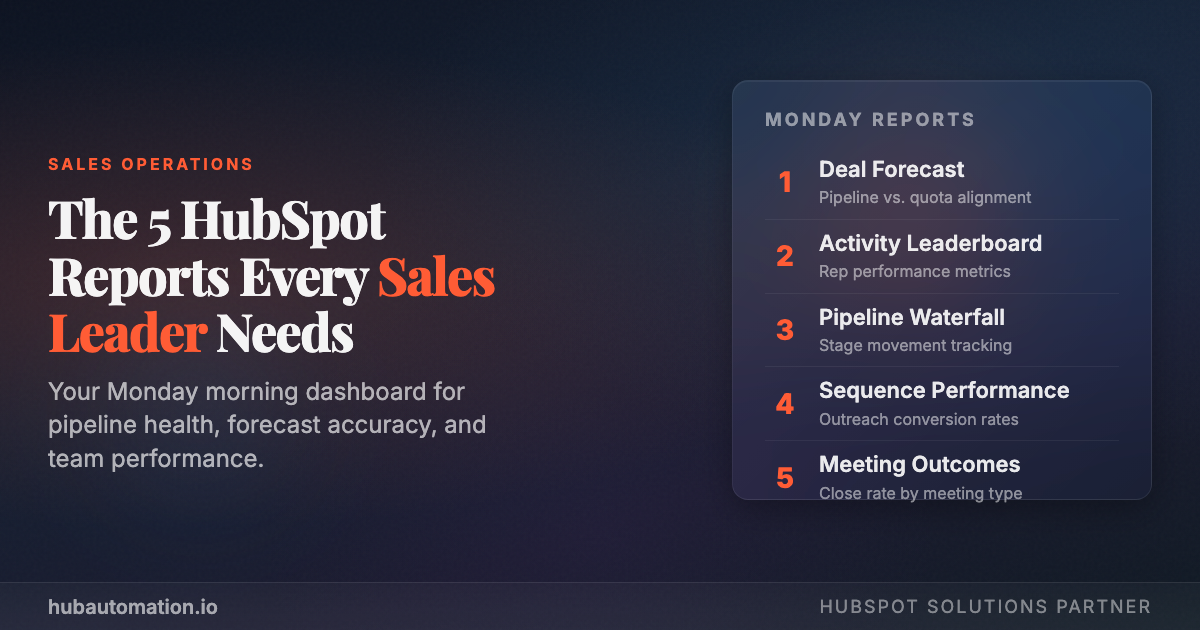
Every Monday morning, your sales team walks into a week full of possibilities, and potential landmines. The difference between teams that consistently hit quota and those that scramble at month-end? They start every week with the same five reports.
These aren't vanity dashboards. They're the five views that tell you exactly where your pipeline stands, who's working (and who isn't), and where your next closed deal is coming from.
Here's the playbook.
1. Deals by Stage: Your Pipeline Snapshot
This is the report you open before your coffee cools down. The Deals by Stage board gives you a visual snapshot of every active opportunity and where it sits in your sales process.
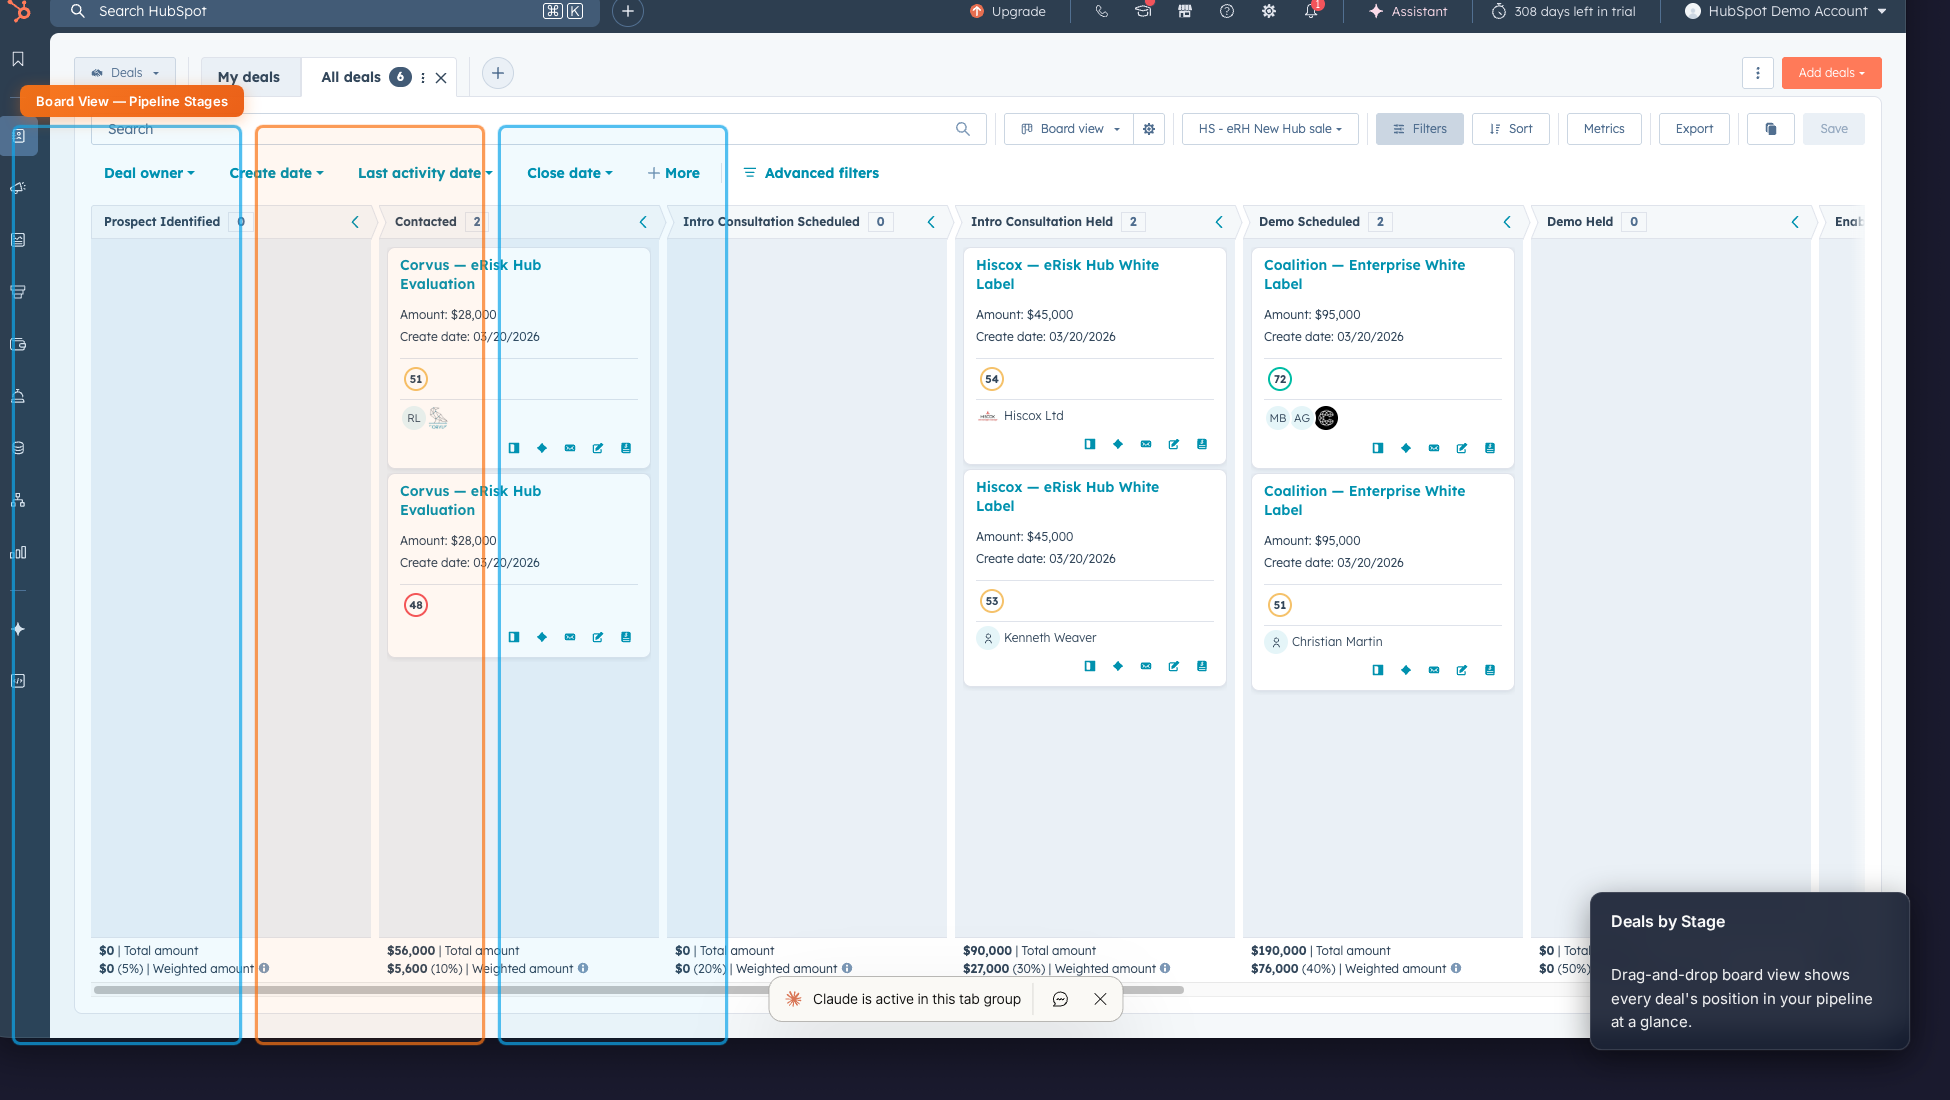
What to look for:
- Stage concentration. Are deals piling up in "Contacted" or "Demo Scheduled" without moving? That's a coaching moment.
- Weighted pipeline value. HubSpot multiplies deal amount by stage probability, giving you a realistic view of what's actually likely to close.
- Aging deals. Anything sitting in the same stage for more than 2 weeks needs attention or needs to be killed.
Action step: Sort by "Last activity date" and flag any deal that hasn't been touched in 7+ days. No activity = no momentum.
2. Deal Win/Loss Analysis: Learn from Every Outcome
Win rate isn't just a number. It's a diagnostic tool. This report filters your closed deals by outcome and surfaces the patterns hiding in your data.
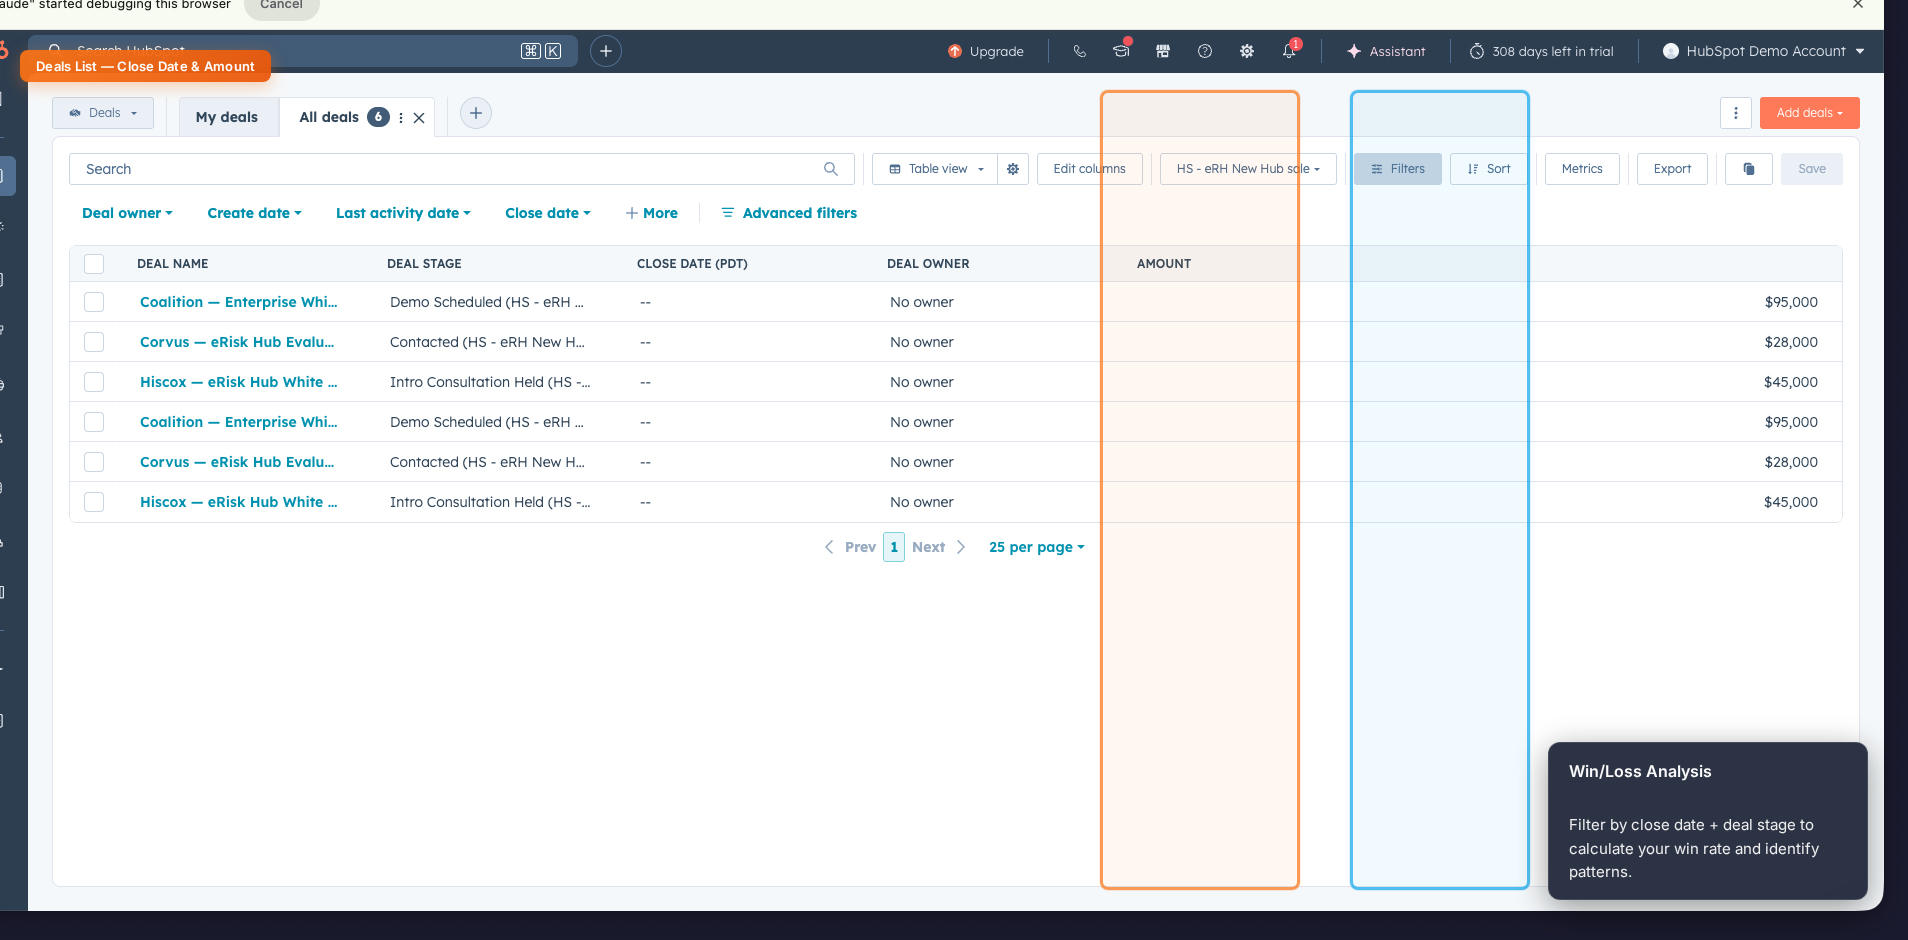
What to look for:
- Win rate by source. Are inbound leads closing at 3x the rate of outbound? Double down on what works.
- Average deal cycle. If your average close takes 45 days but you're forecasting deals to close in 20, your forecast is fiction.
- Loss reasons. Use the "Closed Lost Reason" property to spot trends. If "budget" comes up 40% of the time, you have a qualification problem, not a closing problem.
Action step: Compare this month's win rate to last month. If it dropped more than 5 percentage points, dig into the loss reasons before your pipeline meeting.
3. Revenue Forecast: See What's Actually Coming
Hope is not a forecast. HubSpot's revenue forecast report combines deal amounts, stage probabilities, and close dates to project what's realistically going to land.
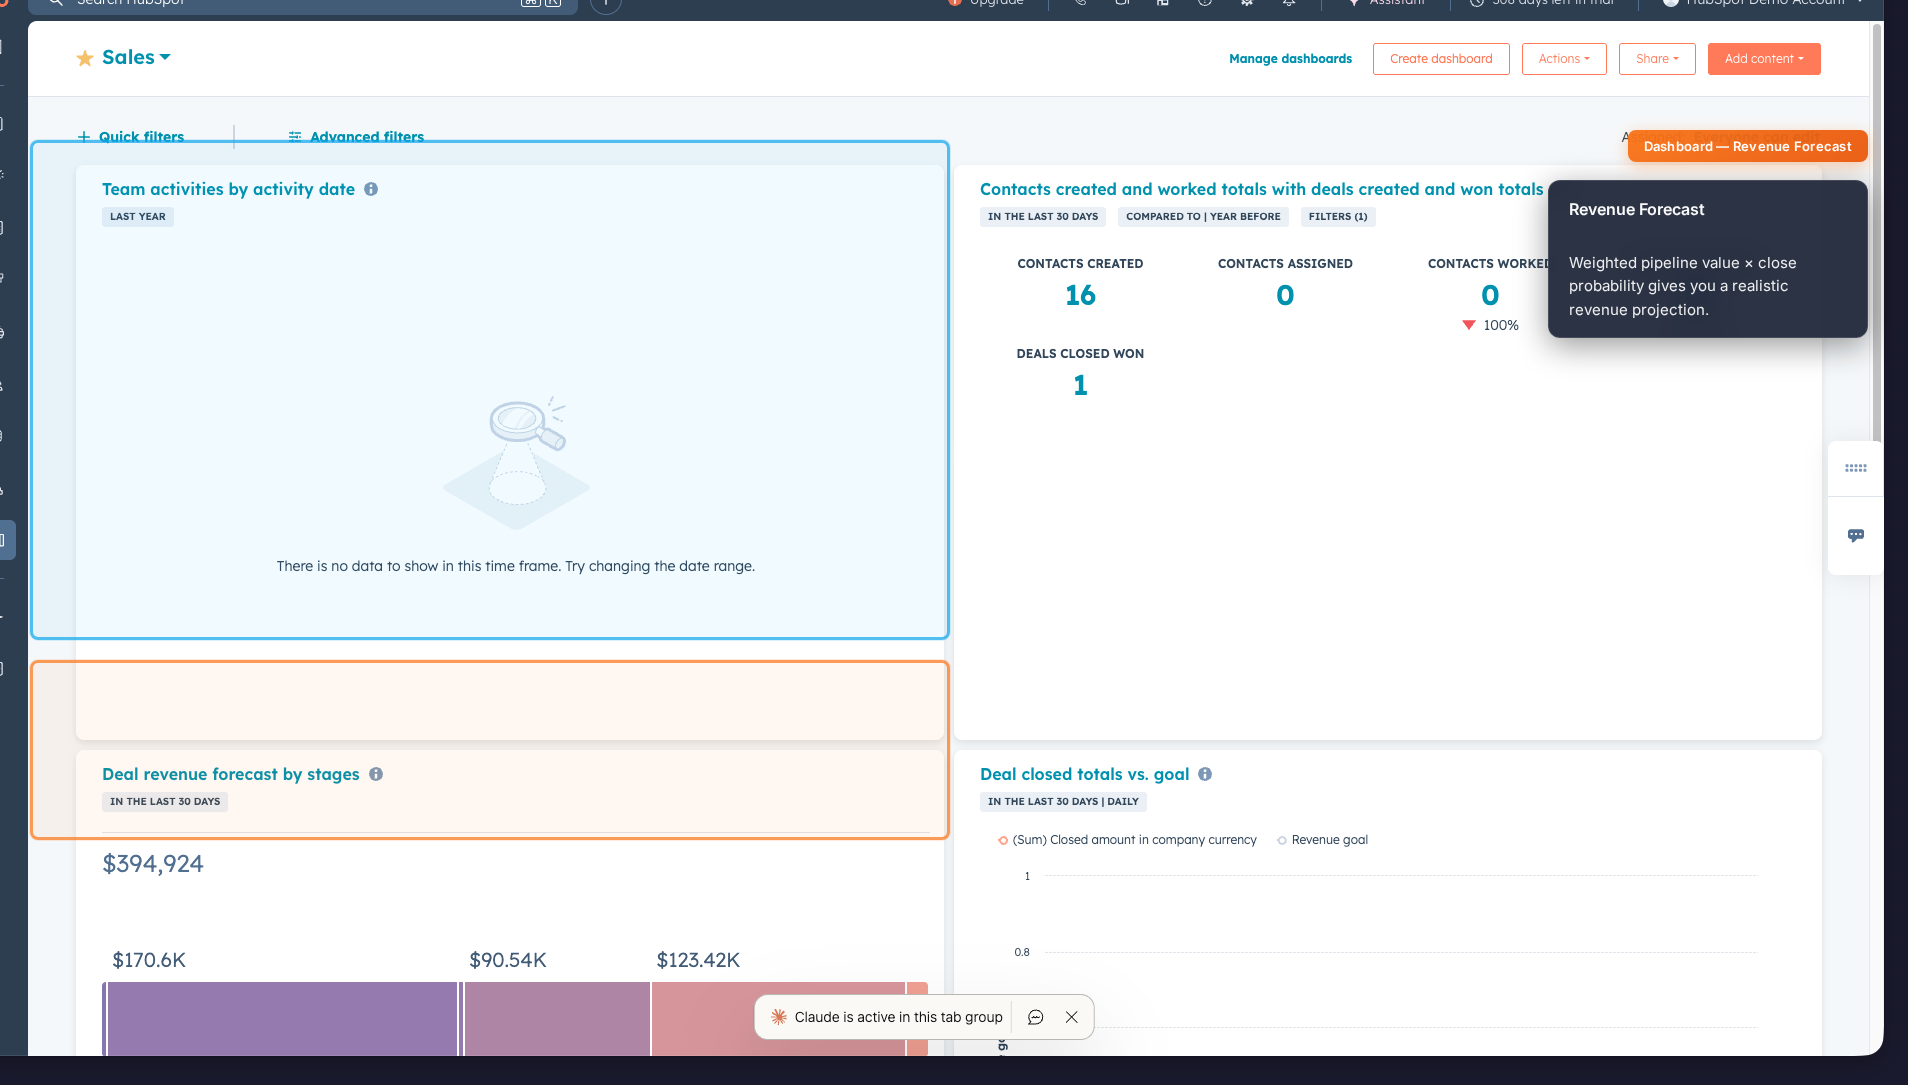
What to look for:
- Forecast vs. quota gap. If your weighted forecast is $80K and your monthly target is $120K, you know exactly how much new pipeline you need to generate this week.
- Close date clustering. 60% of deals closing in the last week of the month? That's a red flag for sandbagging or poor forecasting hygiene.
- Pipeline coverage ratio. Best practice is 3x coverage (3x your quota in total pipeline). Below 2x? Sound the alarm.
Action step: Calculate your pipeline coverage ratio right now. Total open pipeline ÷ monthly quota. If it's below 3x, your team needs to prospect harder this week, not just close harder.
4. Activity Leaderboard: Who's Actually Working?
Sales is a volume game at its core. The Activity Leaderboard tracks calls made, emails sent, meetings booked, and tasks completed. Per rep, per day.
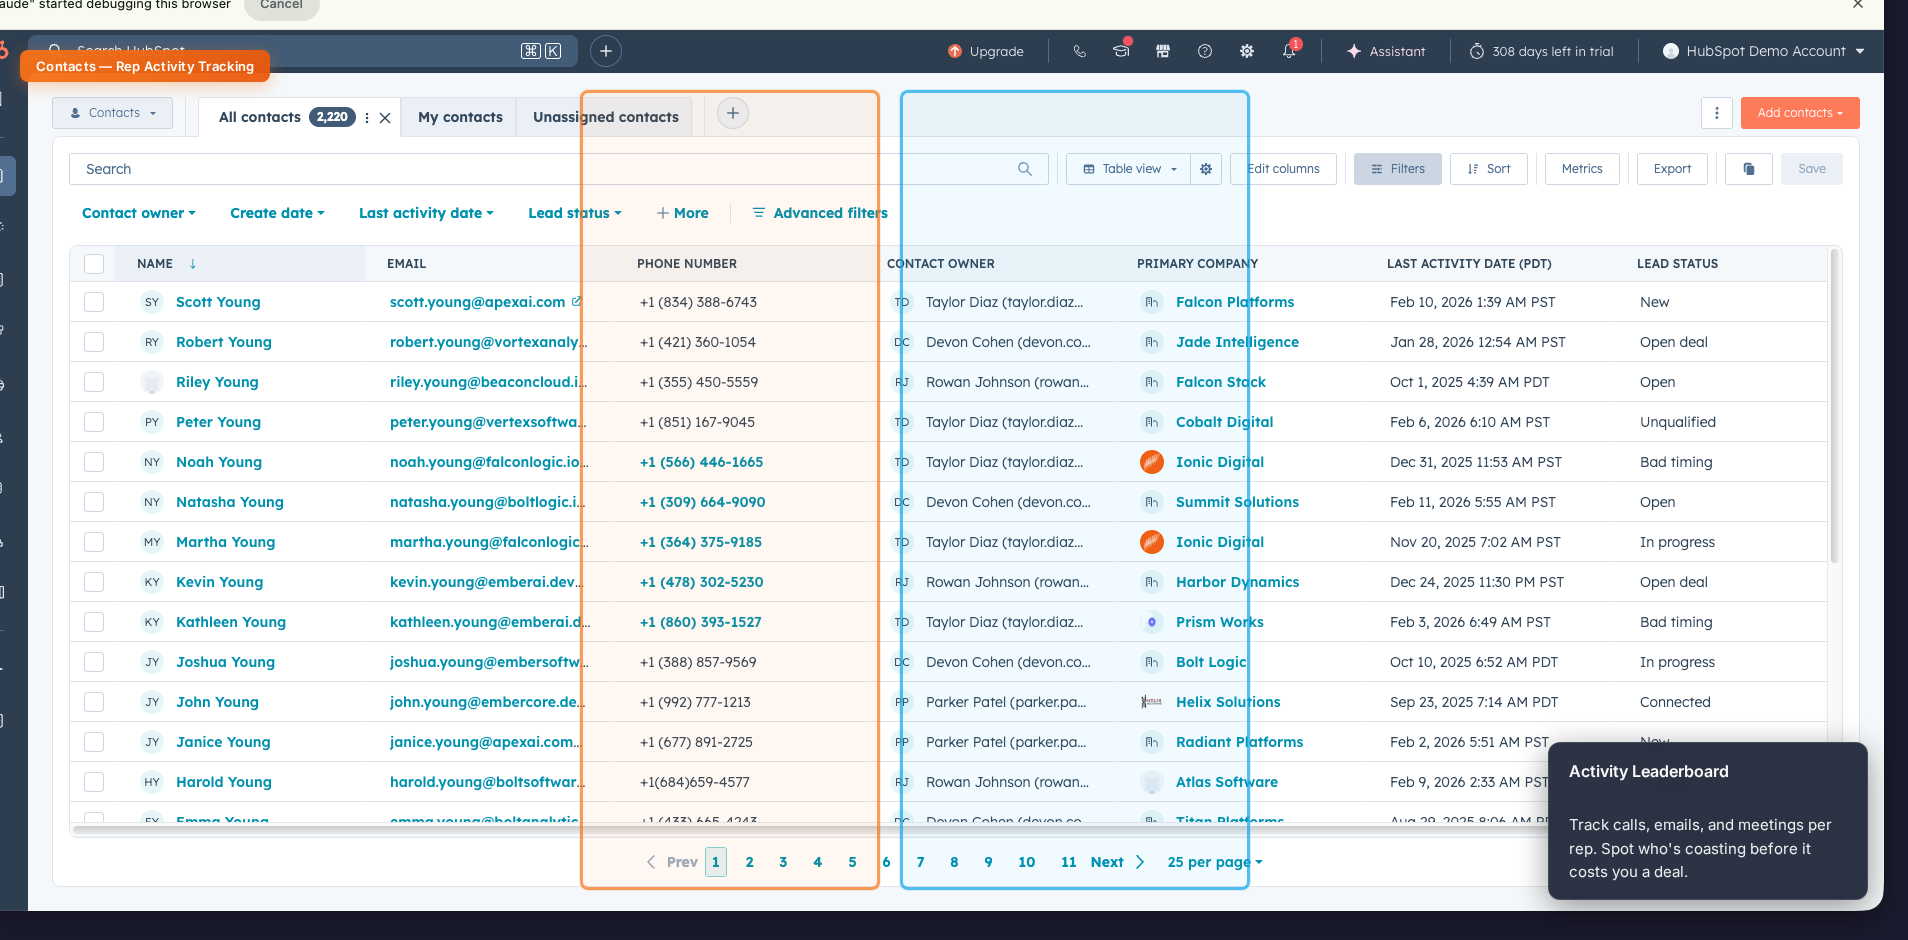
What to look for:
- Activity-to-outcome ratio. Rep A makes 50 calls and books 5 meetings. Rep B makes 50 calls and books 1. That's a script problem, not an effort problem.
- Meeting-to-deal conversion. Track how many meetings each rep needs to create a qualified opportunity. High performers convert at 1 in 3; struggling reps might be 1 in 10.
- Zero-activity days. Any rep with a full day of zero logged activities needs a check-in. Not a lecture, a check-in.
Action step: Set a team minimum for daily activities (e.g., 30 calls, 10 emails, 2 meetings). Review the leaderboard every Monday and make it visible. Accountability drives behavior.
5. Your Custom Monday Dashboard: The Single Pane of Glass
The first four reports give you depth. This one gives you breadth. Build a custom HubSpot dashboard that combines your most critical widgets into a single view you can check in 60 seconds.
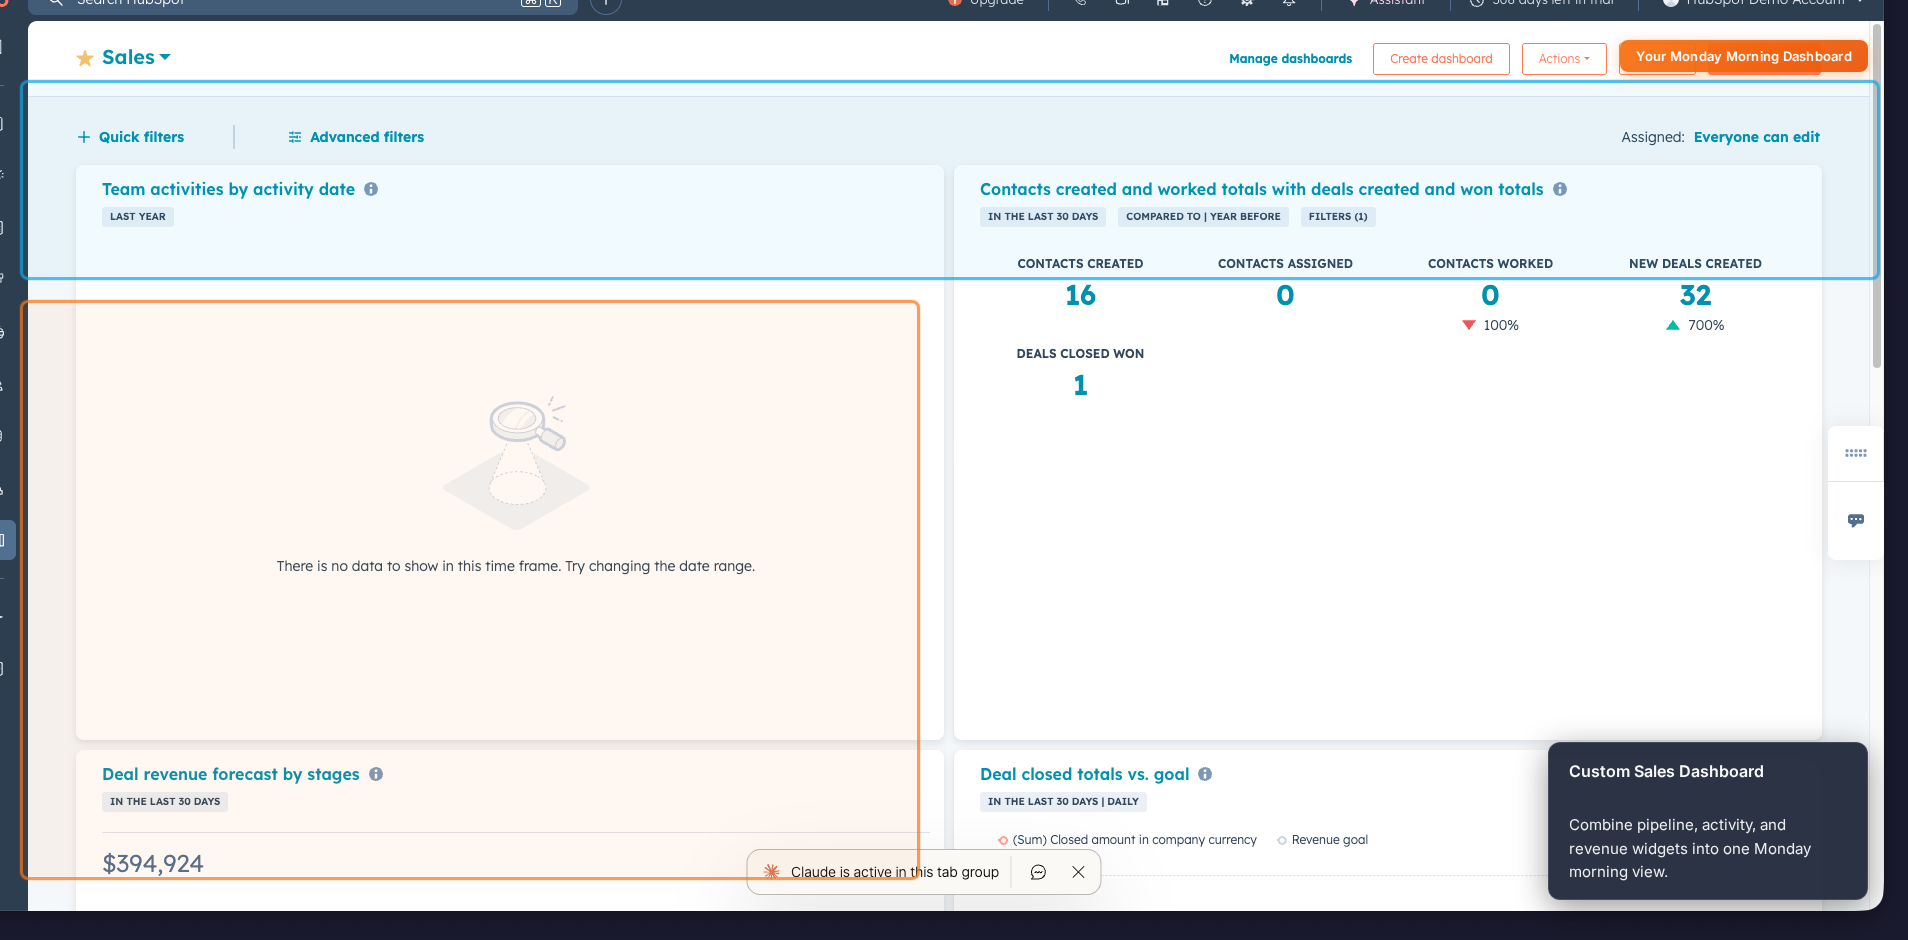
Recommended widgets:
- Pipeline value by stage (bar chart)
- Deals closing this month (table)
- Activities this week vs. last (comparison)
- Revenue forecast (number tile)
- New leads this week (number tile)
- Meetings booked today (number tile)
Action step: Build this dashboard once, pin it as your default, and make it the first thing your browser opens on Monday morning. Share it with your team so everyone sees the same numbers.
The Monday Morning Routine That Closes More Deals
Here's the 15-minute routine that turns these five reports into action:
- 8:00 AM. Open your custom dashboard. Get the 60-second health check.
- 8:02 AM. Check Deals by Stage. Flag stale deals, identify deals that need a push.
- 8:05 AM. Review the Activity Leaderboard. Note who needs coaching this week.
- 8:08 AM. Check the Revenue Forecast. Calculate your coverage ratio.
- 8:12 AM. Scan Win/Loss trends. Adjust your team's approach if loss patterns emerge.
- 8:15 AM. Walk into your pipeline meeting armed with data, not guesses.
The sales leaders who do this consistently don't just hit quota, they make it look easy. Not because they have better reps or bigger territories, but because they never let a problem fester for more than a week.
Need help building these reports in HubSpot? At HubAutomation, we set up the dashboards, automation, and pipeline structure that make this Monday routine effortless. Book a free consultation and we'll show you what your data is trying to tell you.
Want to see where your blind spots are? We run free diagnostics for companies like yours.